
School Districts Are Spending Billions on Curriculum. The Air Students Breathe Is Still an Afterthought.
Peer-reviewed research ties classroom ventilation directly to student test scores and illness absence, and most measured classrooms fall below recommended rates. School indoor air quality monitoring is how districts find out which ones, and prove it.

There is substantial peer-reviewed evidence linking indoor air quality (IAQ) to cognitive performance and attendance. Most school buildings have no system capable of acting on either. Back-to-school season has put thousands of buildings back into full occupancy, and in the majority of them nobody can say what the air in any given classroom is doing right now. School indoor air quality monitoring is the capability that closes that gap. Districts that build it will be setting the standard. Districts that do not will eventually be answering for its absence.
Here is the short version. School indoor air quality monitoring means continuously measuring conditions such as carbon dioxide (CO2), particulate matter, temperature, and humidity in occupied classrooms, then acting on what the readings show. It matters because peer-reviewed studies tie classroom ventilation directly to student test scores and illness absence, because most classrooms measured in those studies fell below recommended ventilation rates, and because the adults in the room cannot detect the problem by feel. Without measurement, a district cannot know which classrooms are affected, cannot fix them on purpose, and cannot demonstrate to anyone that they meet a standard.
What does the research actually say about classroom air and student outcomes?
The evidence is specific and quantified. Two studies carry most of the weight.
On attendance, a prospective study of 162 classrooms across 28 schools in three California districts, published in the journal Indoor Air, found that each additional liter per second per person of ventilation was associated with a 1.0 to 1.5 percent reduction in illness absence. The authors noted the California average at the time was 4.0 liters per second per person against a state standard of 7.1, and calculated that closing that gap would produce a 3.4 percent relative reduction in illness absence. Absence is not a soft metric for a district. In most states it drives funding.
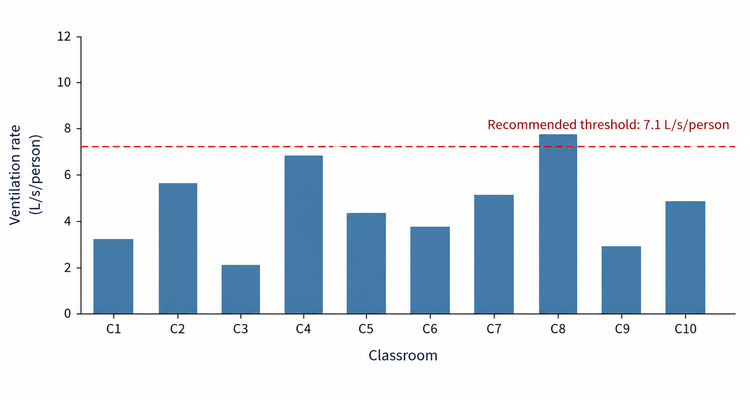
On performance, a study of 140 fifth-grade classrooms across 70 elementary schools, covering 3,109 students, found that math scores rose by roughly 11 points on the state assessment scale for each additional liter per second per person of outdoor air. The authors calculated that ventilation and temperature together could lift an average score of 2,286 past the 2,400 threshold for commended performance. The detail that should stop a superintendent: of those 140 classrooms, only six exceeded the recommended ventilation rate.
A review published in August 2026 in Current Environmental Health Reports pulled this literature together and confirmed that indoor air pollutants negatively affect student academic performance and cognitive functioning. The link is no longer in dispute. What is missing in most districts is not evidence. It is instrumentation.
Why can't teachers and staff just tell when the air is bad?
Because they cannot, and this is the finding that should change how districts think about the problem. The same 2026 review reported that educators' subjective perceptions of indoor air quality are not concordant with objective measures of it. Put plainly, how a classroom feels is not a reliable indicator of what is in the air or how well the room is ventilated.
This matters more than it first appears. Most district IAQ response today is complaint-driven. Someone reports a stuffy room or a headache, and facilities investigates. That model assumes human sensing works as a detector, and the research says it does not. A complaint-driven system will systematically miss the classrooms degrading quietly, which are exactly the ones where a full year of marginal losses accumulates unnoticed.
The Environmental Protection Agency (EPA) adds the scale of what goes undetected, noting that indoor levels of some pollutants can run two to five times higher than outdoor levels, and occasionally more than 100 times higher. It also notes that nearly 1 in 13 school-age children has asthma, the leading cause of school absenteeism due to chronic illness.
How big is the infrastructure gap?
Large, documented, and worsening. The Government Accountability Office (GAO) found that an estimated 54 percent of public school districts need to update or replace multiple building systems, and that 41 percent need heating, ventilation, and air conditioning (HVAC) updates in at least half their schools, which works out to roughly 36,000 schools. HVAC was the single most frequently identified need in the country.
The American Society of Civil Engineers (ASCE) graded school infrastructure a D+ in its 2025 report card and put the annual funding gap for a state of good repair at $85 billion, a 42 percent increase over its previous estimate.
Numbers that large induce paralysis, which is the wrong response. Full HVAC replacement is a decade-long capital program. Knowing which classrooms are failing right now is a different problem with a different price tag, and the one worth solving first.
Why is this a leadership issue and not a facilities issue?
Because the exposure is not operational. It is institutional.
Consider what a district can say when a parent, a board member, or a reporter asks whether the air in a specific building meets any standard. In most districts the honest answer is that nobody knows, because nobody is measuring. That is survivable once, but not after an incident.
A district that can produce a year of classroom-level data showing conditions held within standard owns the conversation. It can support bond campaigns with evidence, defend capital requests with measured need rather than anecdote, and answer parents with a number instead of a reassurance. A district without that data is one incident away from responding to a narrative someone else wrote.
The GAO found districts already rank health hazard monitoring among their top facility priorities. The intent exists. The instrumentation does not.
What happens after a sensor flags a problem?
This is where monitoring either earns its keep or becomes an expensive way to document failure. A reading is not an answer. The work runs in four stages: monitor, identify, investigate, correct.
Monitor. Continuous measurement establishes what normal looks like in each room. Everything downstream depends on that baseline.
Identify. A room breaches a threshold or diverges from its own pattern. This replaces the complaint, and catches the classrooms nobody reports.
Investigate. This is the stage most conversations skip, and it is where the data earns its value. Different readings point at different causes, and reading them together is what narrows the search.
CO2 climbing through the day in an occupied room.
Usually not enough outdoor air for the number of people in it. Check ventilation rate and schedule, outdoor air settings, and the current roster against design occupancy.
Particulate matter elevated while CO2 is normal.
Usually filtration or a source rather than a ventilation rate problem. Check filter condition and rating, duct cleanliness, outdoor intake location, and nearby activity.
Total volatile organic compounds (TVOCs) spiking on a predictable schedule.
Usually an activity rather than the building. Check cleaning product timing and chemistry, art and science supplies, and vocational and home economics spaces.
TVOCs elevated and sustained in one room.
Usually materials releasing compounds over time. Check recent paint, flooring, adhesives, or new furnishings.
Humidity persistently high.
Moisture that can become a mold problem. Check dehumidification, envelope leaks, and drainage.
One caution matters here, and it is the reason a single number is not enough. ASHRAE's position document on indoor carbon dioxide states that indoor CO2 concentrations "are not overall indicators of IAQ, but they can be a useful tool if users understand how they relate to IAQ and the important limitations", and notes they are not necessarily well correlated with pollutants such as mold, formaldehyde, and airborne particles. A district watching CO2 alone will miss what CO2 cannot see. The Environmental Protection Agency (EPA) lists paint, adhesives, flooring, and cleaning materials among common school sources, and flags art, science, and vocational rooms as concentrated source areas.
Correct. Most of what follows costs little. Adjusting a ventilation schedule or outdoor air setting, rebalancing a system, changing filter intervals, running a purge cycle before occupancy, moving a class out of a room whose ventilation was never sized for its roster, or changing when and with what a space gets cleaned. EPA cautions against leaning on filtration alone where managing the source and the ventilation is the better strategy. Capital replacement becomes the last resort rather than the first, and a district that gets there knows which units justify it.
Then the loop closes where it started. Re-measure. A district that adjusts a ventilation schedule without sensors is guessing, and will not know whether it worked until someone complains again. With them, the same data that found the problem verifies the remedy and documents it for the board, for grant reporting, and for the next budget cycle. Measure, act, verify.
Where IotaComm fits
The hard part is not collecting the readings. It is knowing what they mean. Delphi360, IotaComm's operational intelligence platform, consolidates data from sensors, building systems, equipment, and energy systems into a single view, and surfaces the trends and anomalies that help a facilities team understand what the readings mean and decide what to investigate next. The platform does not operate the building. It gives the people who do a far better starting point than a complaint and a hunch, and it produces the reporting that compliance, sustainability, and leadership require. That is what turns a sensor network into an accountability record a board and a community can actually see.
Getting data reliably out of a school building is the other half of the challenge. IotaComm uses IotaWave™, its low-power wide-area network (LPWAN) connectivity layer built on LoRaWAN® technology, to transmit sensor data independently of the building's existing Wi-Fi and information technology infrastructure. This helps sensors maintain connectivity in hard-to-reach areas such as basements, older wings, and portable classrooms without competing with the network used for instruction and testing or creating an additional burden for the IT department.
Allentown School District selected IotaComm's smart building solution for K-12 education, using sensors that capture volatile organic compounds, humidity, temperature, occupancy, particulate matter 2.5, CO2, and light levels. Tom Smith, the district's Facilities Executive Director, put the outcome this way: "These sensors helped us maintain a healthier learning environment — and secure additional grant funding based on the 20 million data points we've collected so far." The data did not only improve conditions. It helped pay for more of them.
More is on the indoor air quality solution page and the education sector page, and our earlier piece on how IAQ affects student health and performance covers the classroom-level case in more depth.
Frequently asked questions
What is school indoor air quality monitoring?
It is the continuous measurement of conditions in occupied classrooms, typically carbon dioxide, particulate matter, temperature, and humidity, paired with a process for acting on the readings. Carbon dioxide is commonly used as a proxy for whether a room is getting enough outdoor air for the number of people in it.
Does classroom air quality really affect test scores and attendance?
Yes, and the effect has been quantified. Research in Indoor Air associated each additional liter per second per person of ventilation with a 1.0 to 1.5 percent reduction in illness absence. Research in PLOS One associated the same increment with roughly 11 additional points on state math assessments among fifth graders.
Can staff detect poor air quality without sensors?
No. A 2026 review in Current Environmental Health Reports found that educators' subjective perceptions of indoor air quality do not match objective measurements. Complaint-driven response will miss classrooms where conditions degrade without an obvious symptom.
The accountability window is open now
The research is settled, the infrastructure gap is documented, and the measurement technology is mature and deployable without rebuilding a district's network. What remains is a choice about timing.
Districts that implement school indoor air quality monitoring while it is still optional define what good looks like, build the evidence record on their own schedule, and walk into board meetings with data. Districts that wait do the same thing later, under pressure and without the credit. To see what this looks like in a district like yours, talk with the IotaComm team.
Sources
Mendell et al., Association of classroom ventilation with reduced illness absence, Indoor Air, 2013:
Haverinen-Shaughnessy and Shaughnessy, Effects of Classroom Ventilation Rate and Temperature on Students' Test Scores, PLOS One, 2015:
https://journals.plos.org/plosone/article?id=10.1371/journal.pone.0136165
Cooke, Levy Zamora, and Hollenbach, School Indoor Air Quality's Impact on Student Achievement and Educator Experience, Current Environmental Health Reports, 2026:
https://link.springer.com/article/10.1007/s40572-026-00556-4
U.S. Government Accountability Office, GAO-20-494, K-12 Education: School Districts Frequently Identified Multiple Building Systems Needing Updates or Replacement, 2020:
American Society of Civil Engineers, 2025 Infrastructure Report Card, Schools:
https://infrastructurereportcard.org/cat-item/schools-infrastructure/
U.S. Environmental Protection Agency, Why Indoor Air Quality is Important to Schools:
https://www.epa.gov/iaq-schools/why-indoor-air-quality-important-schools
U.S. Environmental Protection Agency, Reference Guide for Indoor Air Quality in Schools:
https://www.epa.gov/iaq-schools/reference-guide-indoor-air-quality-schools
ASHRAE, Position Document on Indoor Carbon Dioxide: